DOE
- dhasna22
- Feb 4, 2024
- 3 min read
Hi people ! This time I'm back to share with y'all my knowledge on DOE - Design Of Experiments through this case study :)
So the case study is about finding the cause of losing popcorn yield when making microwave popcorn.
Let me start by CLEARLY stating what needs to be known,
Bullets : un-popped kernels
Factor A : Diameter of bowls to contain the corn, 10cm and 15cm Diameter of bowls to contain Factor B : Microwaving time, 4 and 6 minutes
Factor C : Power setting of microwave , 75% and 100%
FULL FACTORIAL DATA ANALYSIS ,
Below is the data obtained for 8 runs of experiment with 100g of corn .
Effects of single factors and its ranking


With the aid of the table above , I plotted the line graph seen on the left by using data of the high and low values of the three different factors as seen below !

From the graph above, we can deduce that C is most significant followed by B and lastly A ! This is because the steeper the gradient of the line , the more significant the change caused by the factor and so in this case C (power) having the steepest gradient causes it be the most significant factor .
2. Interaction factors
Between AxB,


Again , using the table above I plotted the graph seen on the left by using the values under the average column.
Gradient of Low B is positive whereas gradient of High B is negative. Thus, different gradients indicate that there is significant interaction between Factor A and B ( diameter and microwave time)
Between AxC,


Based on the table above we can see the average value of high and low A at high and low C
Again , since gradient of Low C is negative and gradient of High C is positive we can state that interaction between factor A and C (diameter and power) is significant due to difference in line gradient .
Between BxC,


Gradients of both lines are similar and only slightly differ by little margin . Thus, compared to interaction between AxB and AxC interaction between BxC is much smaller.
In conclusion ,
When we individually compared the three different factors we could acknowledge that the most significant to least significant factor is C>B>A.Instead of leaving at there with deeper analysis of the various interactions between the three factors we can now agree that the most significant interaction to least significant interaction is AB>AC>BC. Although interaction significance between AC and AB are almost similar, the gradients of the lines in the graph for AC are slightly more gentle than gradients of the lines in the graph for AB. In contrast , gradients of the lines in the graph of BxC are the same and only differ by slight margin thus, it can be stated that interaction between B and C is very little.
FRACTIONAL FACTORIAL DATA ANALYSIS,
For fractional factorial I had to choose 4 runs out of the 8 runs and I chose runs 2,3,4 and 5 as all factors have good statistical properties and is said to be orthogonal.
Below is the table I used and the graph I plotted to rank the effect on the three different factors.
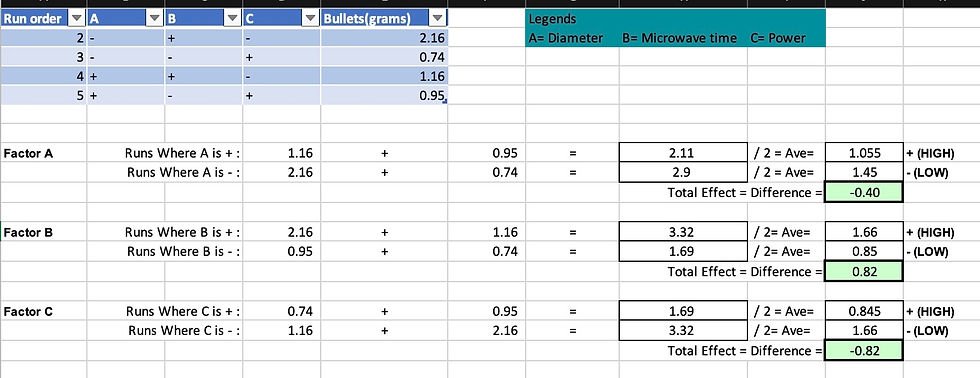
Using the values of High and Low values for each factor , I created another table and plotted a graph!!

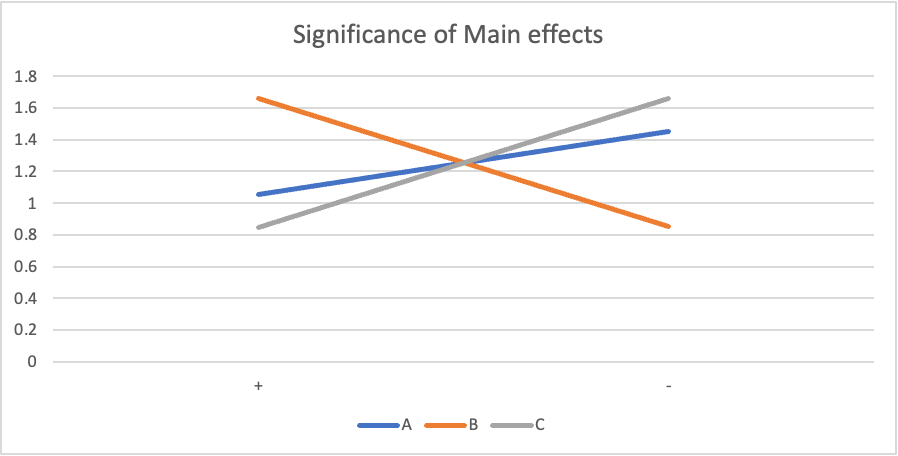
From the above graph , Gradient of line C has a positive steep gradient whereas, line B has a steep negative gradient. Line A also has a positive gradient but compared to line C it has a more gentle gradient. Thus, I would rank the factors from most significant to least significant as C>B>A.
Learning Reflection ,
When I first learnt about DOE I believed that it was tedious and completely unnecessary . However, after multiple practices I understand how helpful this system is in allowing us to breakdown and understand complex experiments. We can quickly find out the most influential factor in an experiment and the optimal conditions of all the various factors in an experiment. This approach enhances decision making, efficiency and optimisation if used and I can see how it will come in handy to me in my Final Year Project. Following that , the major need to use excel has definitely sharpened my excel skills. I am definitely more confident although using Excel on MacBook can be extremely frustrating.None the less, I learnt a lot of valuable skills in learning and applying this knowledge of DOE.


Comments